THE SHILLER CAPE, RATE CYCLES & FINANCIAL REPRESSION
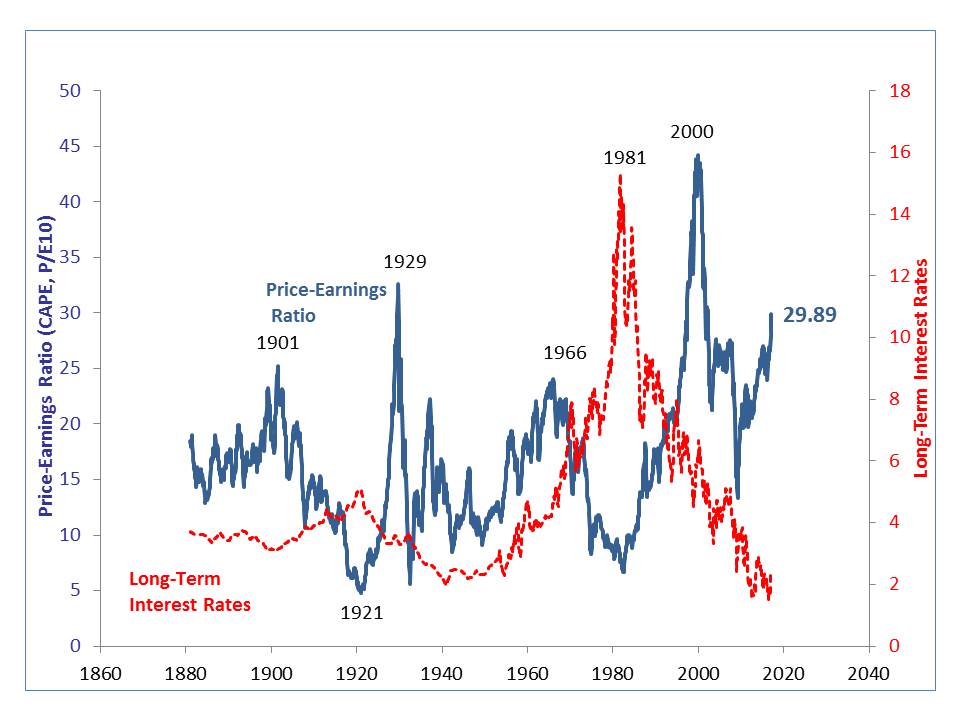
The Shiller CAPE (Cyclically Adjusted Price-Earnings) Ratio is found to be inversely correlated to interest rates over long periods of time. Generally you would expect PE’s as well as the 10 year Shiller CAPE to expand as interest rates fall and to contract as they rise.
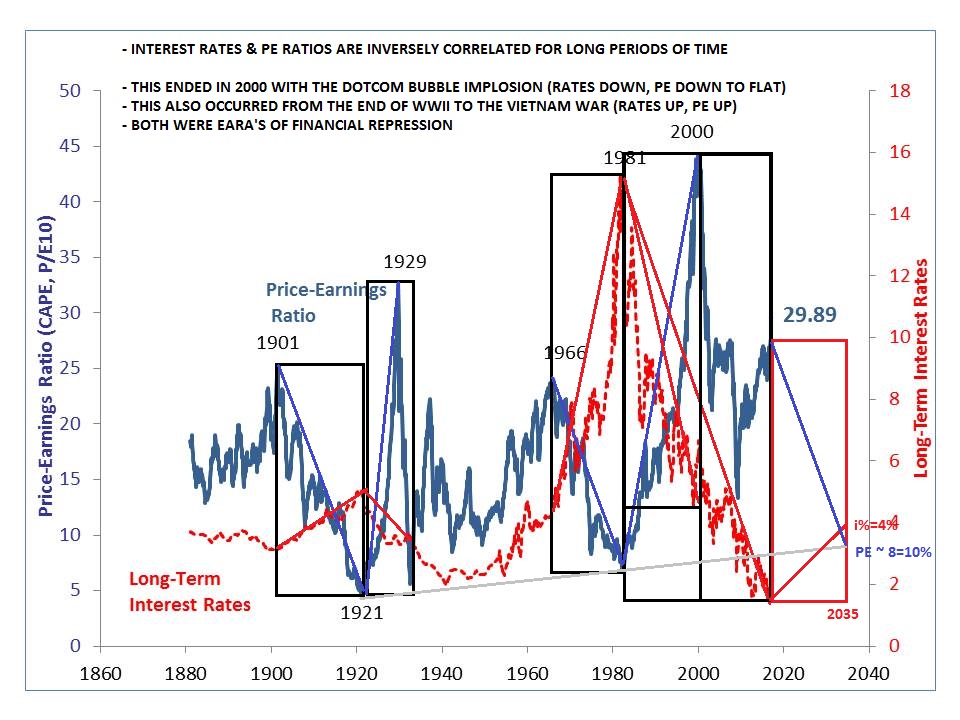
 What may be more important is that in periods of stability interest rates trend higher or lower for long stretches of time. The chart below “blocks” those periods when the inverse correlation was followed.
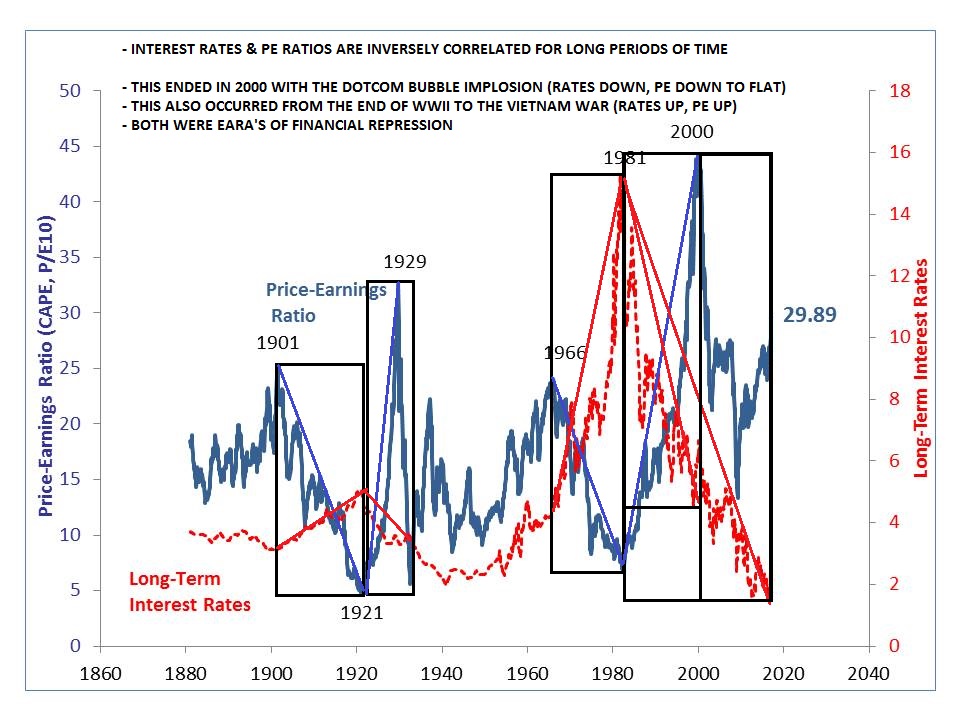 You will notice above that there are two periods when interest rates and the Shiller CAPE were not inversely correlated but followed the same direction:
- The 1930’s through to the Vietnam War.
- After the Dotcom Bubble in 2000 through to the 2008 financial crisis.
What we know about these two eras is that Macroprudential policies of Financial Repression were followed by the US Federal Reserve to address excessive government debt buildup as well as a period of very slow to contracting economic growth.
Following 2008 the Shiller CAPE and Long Term Interest Rate ratio appears on the surface to have established its inverse relationship.
Does this mean Financial Repression has ended or is the expansion in PE’s since 2008, while rates fell, something else and in fact we are still in an Era of Financial Repression which will continue for an extended period into the future? Our chart correlation appears to become somewhat confusing?
The way to clarify where we are and what is likely to unfold is to consider the Shiller CAPE in isolation. When we do this it is pretty evident that we are very close or approaching a top and subsequent reversal in expansions in the Shiller CAPE
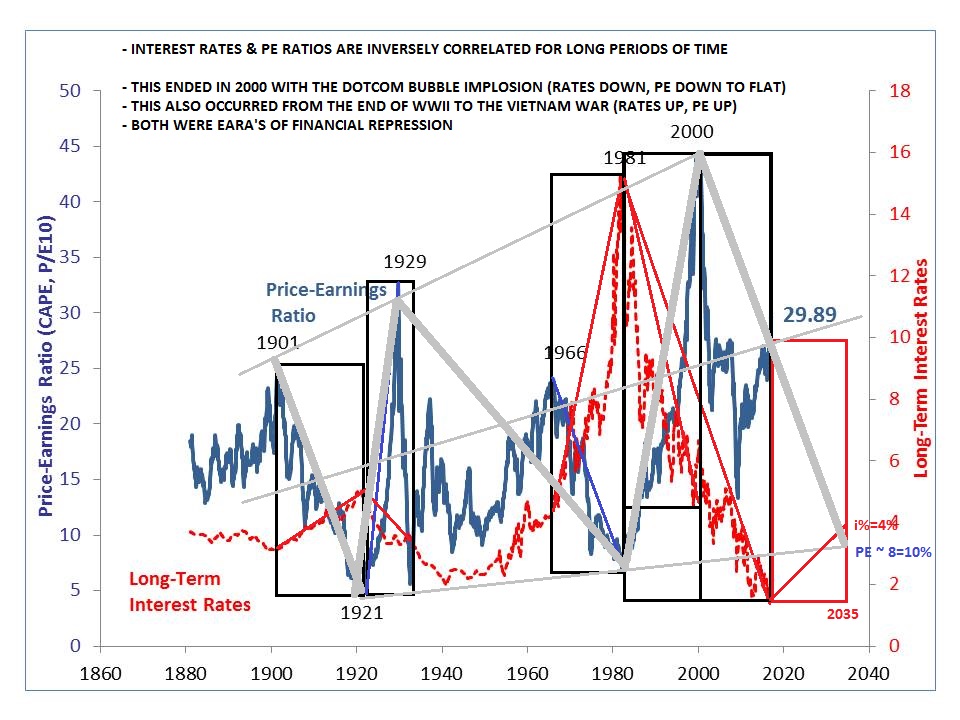
If this is the case, then it suggests the Federal Reserve will soon ‘lose out’ to market or political forces in controlling Financial Repression policies regarding interest rate policy. The grey trend lines below suggest major secular waves are hard for central bankers to overcome.
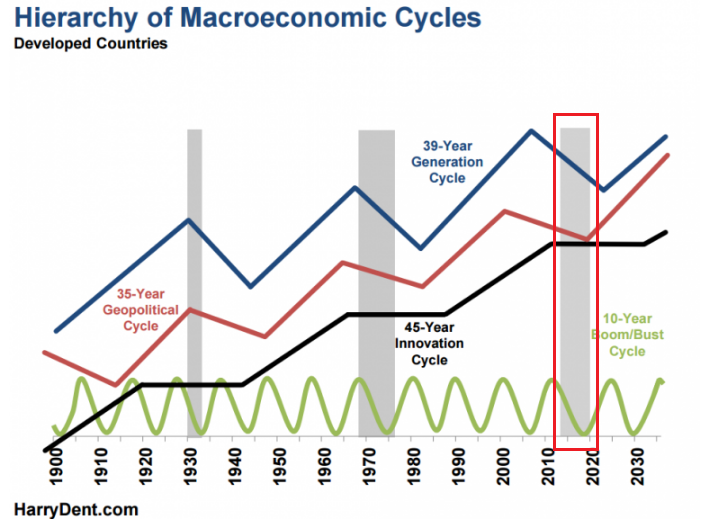
Our Financial Repression interviews with cycle experts such as Harry Dent and Martin Armstrong, as well examination of the Kondratieff Cycle, suggests this to likely be the case.
The chances are now high that by 2020 when most of our long cycles reverse that the gig will be up for the central bankers!
This also correlates with the end of the Trump administrations first term who clearly have issues with the role of the Federal Reserve as they begin to assume power.
The charts suggest that the Shiller CAPE may possibly begin a return to its historical levels of 8-10% while Long Term Interest rates move towards their more historical norms of 4%
Maybe we are simply reading too much into the charts but it is an interesting set of correlations to consider during this period of maddening market messages!



 03/11/2017 - THE SHILLER CAPE, RATE CYCLES & FINANCIAL REPRESSION