
 04/10/2016 - Michael Oliver – LIBERTARIANISM, AUSTRIAN ECONOMICS & MOMENTUM STRUCTURAL ANALYSIS – Part I – Philosophy
This is the first installment in a two part series in which FRA Co-founder Gordon T. Long delineates the foundations for Momentum Structural Analysis with Michael Oliver, Founder of Momentum Structural Analysis (MSA).
Michael Oliver entered the financial services industry in 1975 on the Futures side, joining E.F. Hutton’s International Commodity Division, headquartered in New York City’s Battery Park. He studied under David Johnston, head of Hutton’s Commodity Division and Chairman of the COMEX. In the 1980’s Oliver began to develop his own momentum-based method of technical analysis. He learned early on that orthodox “price chart technical analysis” left many unanswered questions and too often deceived those who trusted in price chart “breakouts,” support/resistance etc.
In 1987 Oliver, along with his futures client accounts (Oliver had trading POA) technically anticipated and captured the Crash. At that point Oliver began to realize that his emergent momentum-structural-based tools should be further developed into a full analytic methodology. In 1992 he was asked by the Financial VP and head of Wachovia Bank’s Trust Department, then headquartered in Winston-Salem, NC, to provide soft dollar research to Wachovia. Within a year Oliver shifted from brokerage to full-time technical research. Oliver is the author of The New Libertarianism: Anarcho-Capitalism and has lead MSA in providing its proprietary technical research services to financial and asset management clients continually since 1992.

“Everybody thinks they have a handle on what momentum means. If you’re a momentum trader that means you chase ups and downs, and this is not what I do. Price in many aspects is delusional, so I de-trend price and look at price through its momentum action; I create momentum charts and analyze that, then reference price secondarily.”
MOMENTUM STRUCTURAL ANALYSIS
The core of technical analysis is very much outdated for it being based on price chart analysis. It is about time for a change, while it is better than fundamental analysis in some respects there is still many deficiencies embedded in price chart analysis which are overcome through momentum structural analysis.
“It is important to realize that Austrian economists are the key bulwark against central banks. They are very important, and have good analysis which I always agree with, however their timing is lacking and that’s where I come in. It is one thing to be right, and another to be right in a timely manner.”
One concept which I adhere to which is pre-politics and pre-economics, is that man is a conceptual being. Man formulates concepts, ideas, circumstances etc. with an underlying basis of some sort of measurement. But there is always a unit of measurement which man needs to build concepts around so that these concepts have consistent validity overtime.
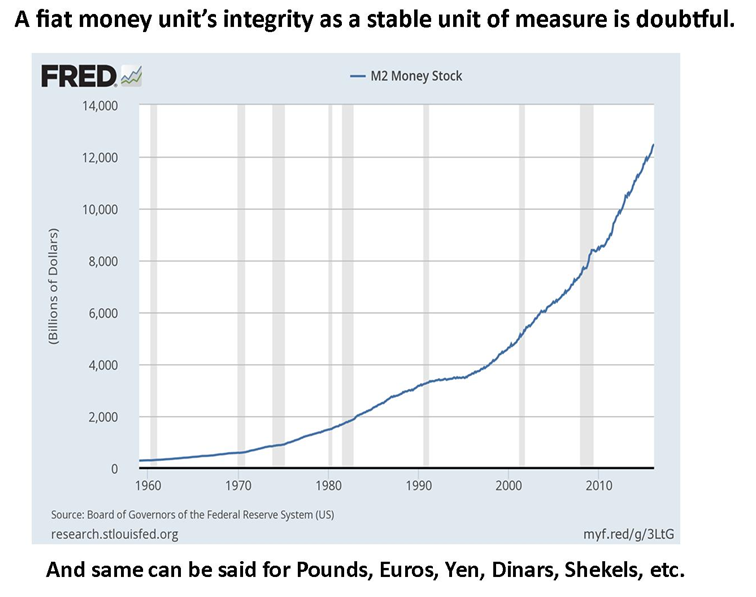
It is essential to have a unit of measurement which remains stable; from this stability you begin to measure and form concepts. The problem with the financial world is that we all use measurements in dollars and it is by no means a stable measurement. Additionally the growth in dollars within the economy is not distributed uniformly everywhere, investors have preferences which tend to shift. Because of this, this unit of measure, the dollar, has to be views with extreme skepticism; you cannot introduce meager metrics like the CPI to compensate.
A well-known orthodox technician, Bob Farrell had 10 rules of investing and #1 was ‘markets always return to the mean.’ This is a widely accepted assumption and a widely overlooked one by trend followers.
“Markets breathe, and failure to acknowledge this is suicide.”
What we do is we measure means; we do not just lay a moving average on a price chart which doesn’t help at all. One of the great things that momentum analysis does is it finds repetitive market action which can be seen better compared to looking at a price chart. MSA is always focused on the different trends a market might have because markets never have one trend. They may have long term trends which within them consist of countercyclical sub-trends which if you’re are not cognisant of can really hurt you.
What we try to do with momentum is, since we cannot totally ignore price because it is nonetheless part of the momentum measuring process, we measure price bars in relation to averages of our choice. We oscillate monthly bars in relation to the averages and we get a visual construct of the market once we create the momentum chart which often reveals alarming data.

“You get a totally different view of the trend reality in the market when you see it through a momentum chart versus a price chart.”
Where momentum plays its greatest role and it is also where most money is lost or made is at the market peaks and bottoms. This is where you experience great swings to your benefit or to your loss.
Abstract written by, Karan Singh Karan1.singh@ryerson.ca
Video Editor: Sarah Tung sarah.tung@ryerson.ca