 02/03/2016 - RISK MITIGATION: FRA Warns to Beware of the FANTAsy of ETFs
The rise of index ETFs and mutual funds which all depend on the FANTAsy stocks, has never accounted for this much of the market before. The rapid emergence of Index ETFs accounted for nearly 30 percent of the trading in the U.S. equities market last summer. FANTAsy weakness will magnify, or even potentially cause flash crashes if they break critical support levels. This is an untested $1 trillion stock bubble problem! The FRA examines the problems and where FANTAsy may be headed.
FANG & NOSH
As we entered Q4 earnings season and the economic news continued to deteriorate, it was clearly evident that we had eight stocks called “FANG & NOSH” holding up the US equity markets. Market breadth had collapsed but not the indexes – yet!
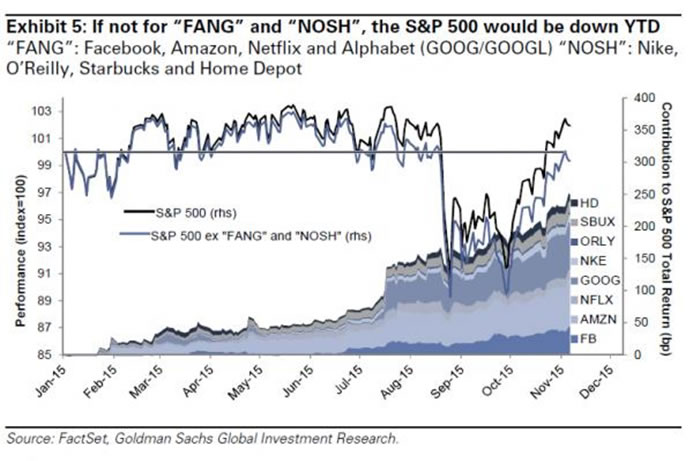
“FANG” STOCKS
- Facebook,
- Amazon,
- Netflix and
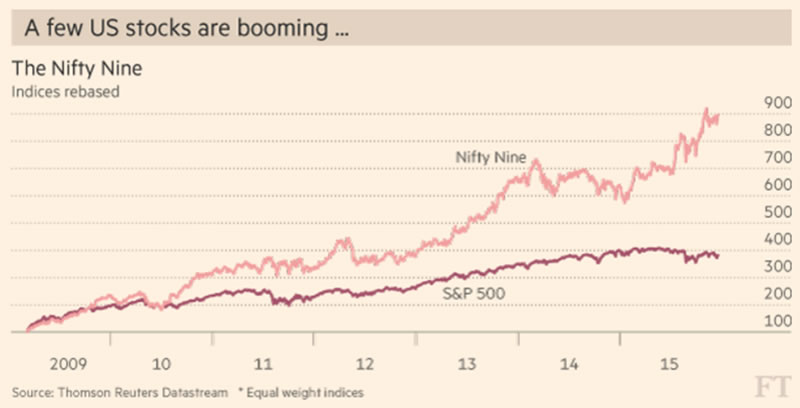
THESE EIGHT BECAME THE “NIFTY NINE”
While the S&P languishes unchanged in 2015, these small groups of overwhelmingly propagandized stocks were up on average over 60%, but with a collective P/E of 45, they were not cheap.
Ned Davis Research identified the NIFTY NINE in December, which added the following to the four FANGs:
- Priceline,
- Ebay,
- Starbucks,
- Microsoft and
- Salesforce. (Note that Apple appears on neither list which until recently was THE MARKET and accounted for 20% of the underlying Margin Expansion since 2010.)
WE HAD FALSE EUPHORIA CENTERED ON 9 STOCKS
This was very similar to what we have witnessed at all bubble tops.
Only the names change (the 4 Horsemen in the Dotcom Bubble run-up: Cisco, Intel, Microsoft & Qualcomm) and the rationalization hype (2000: “new economic paradigm”)
“NIFTY9” HID THE FACT THAT INSTITUTIONS HAD LEFT THE PARTY
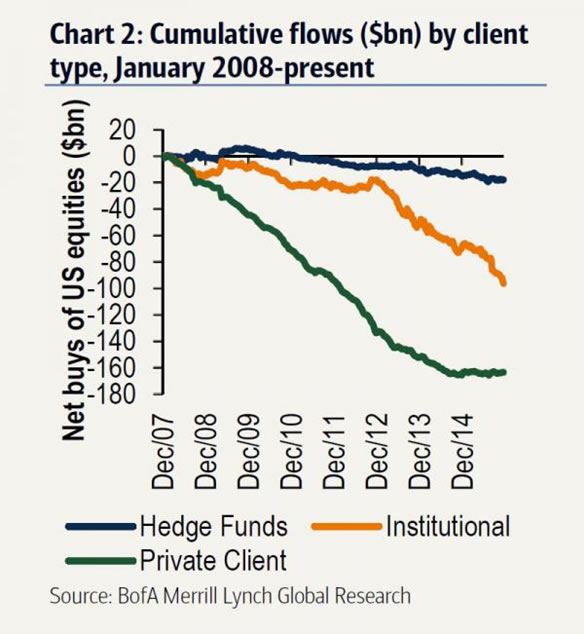
Institutions were seeing the following Sales Growth was no longer there,
Earnings were steadily falling,
Companies were spending more on Buybacks and Dividends than they were actaully earning:
Almost 60 percent of the 3,297 publicly traded non-financial U.S. have bought back their shares since 2010.
In fiscal 2014, spending on buybacks and dividends surpassed the companies’ combined net income for the first time outside of a recessionary period, and continued to climb for the 613 companies that have already reported for fiscal 2015.
In the most recent reporting year, share purchases reached a record $520 billion. Throw in the most recent year’s $365 billion in dividends, and the total amount returned to shareholders reaches $885 billion, more than the companies’ combined net income of $847 billion.
Spending on buybacks and dividends has surged relative to investment in the business. Among the 1,900 companies that have repurchased their shares since 2010, buybacks and dividends amounted to 113 percent of their capital spending, compared with 60 percent in 2000 and 38 percent in 1990.
Among approximately 1,000 firms that buy back shares and report R&D spending, the proportion of net income spent on innovation has averaged less than 50 percent since 2009, increasing to 56 percent only in the most recent year as net income fell. It had been over 60 percent during the 1990s.
FANTAsy – FAN + Tesla + Alphabet
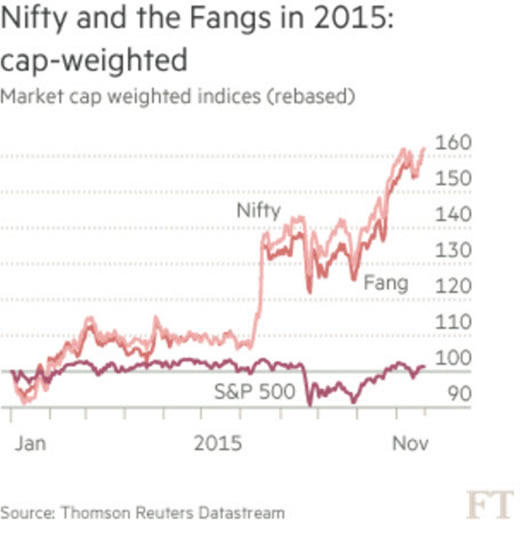
At the end just before the markets began collapsing at year beginning 2016, we had the FANTAsy stocks. This included the core FAN plus Tesla and Alphabet (Google).
By considering an Equal-Weighted Stock Index which removes the FANTAsy distortions from the market many technicians were able to identify clearly what was occurring.
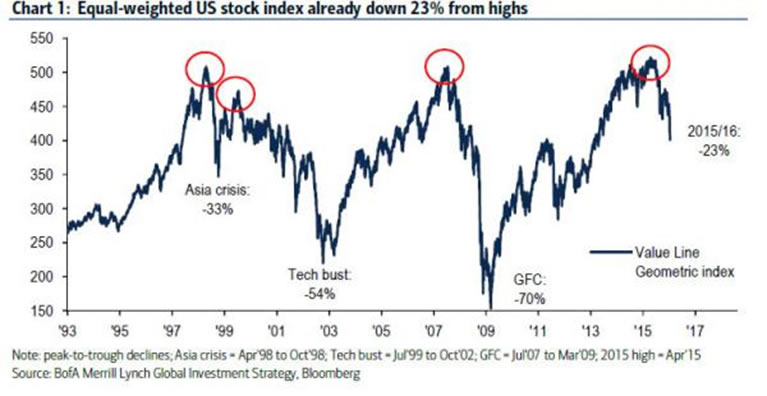
“FAN” HAS BROKEN DOWN – Possible Near Term Support and Then Another Drop??
CONCLUSIONS
A technical view of the equal-weighted US stock index may help resolve the support question.
It appears to suggest the market has further to fall in Q1 2016!
Caution is advised, as it has been since we first identified the FANGs in the market,
which could really bite the unsuspecting!